

Zabbix is an open-source monitoring tool for servers, networks, IT components, cloud services, and virtual machines. The Zabbix monitoring tool is used to give monitoring metrics and monitor network use, storage space consumption, and CPU load. The utility works with a variety of operating systems, including Mac OS, Solaris, Linux, and others. The tool stores data and monitors apps in a separate database. The Zabbix monitoring tool is written in the C programming language, with the web front written in PHP.
What exactly is Zabbix?
It is the name of the software that is used to keep an eye on network server applications so that performance bottlenecks can be found and fixed.
A client-server architecture is used in the Zabbix tool, and a tiny agent is deployed on the client side to collect data and send it to the Zabbix server.
To secure data, the Zabbix utility employs encrypted communication. It has numerous components, such as a server, a web interface, database storage, an agent, and a proxy.
The programme has various functions that allow the user to monitor network servers and apps.
Zabbix is an open-source monitoring programme that may be used as a monitoring platform in the education, energy, finance and banking, government, healthcare, and marketing sectors.
All sectors may be monitored in real-time to identify problems in the network and servers. Its utility collects and analyses data in order to provide performance metrics.
Why do we employ Zabbix?
It is used to keep track of servers and apps. The tool has various features, which are listed below:
1. Data Gathering
The Zabbix tool looks for application performance bottlenecks and application availability in this feature. Custom checks are also supported by the utility. JMX, IPMI, and SNMP are among the monitoring services provided by the tool.
2. System of Notification
The user can be alerted of a problem with the networking servers. Notifications can also be personalised. The user may additionally tailor the actions so that they are automatically executed when an error occurs in the system. Notifications can use macro variables to let users know about things through channels like email, SMS, and so on.
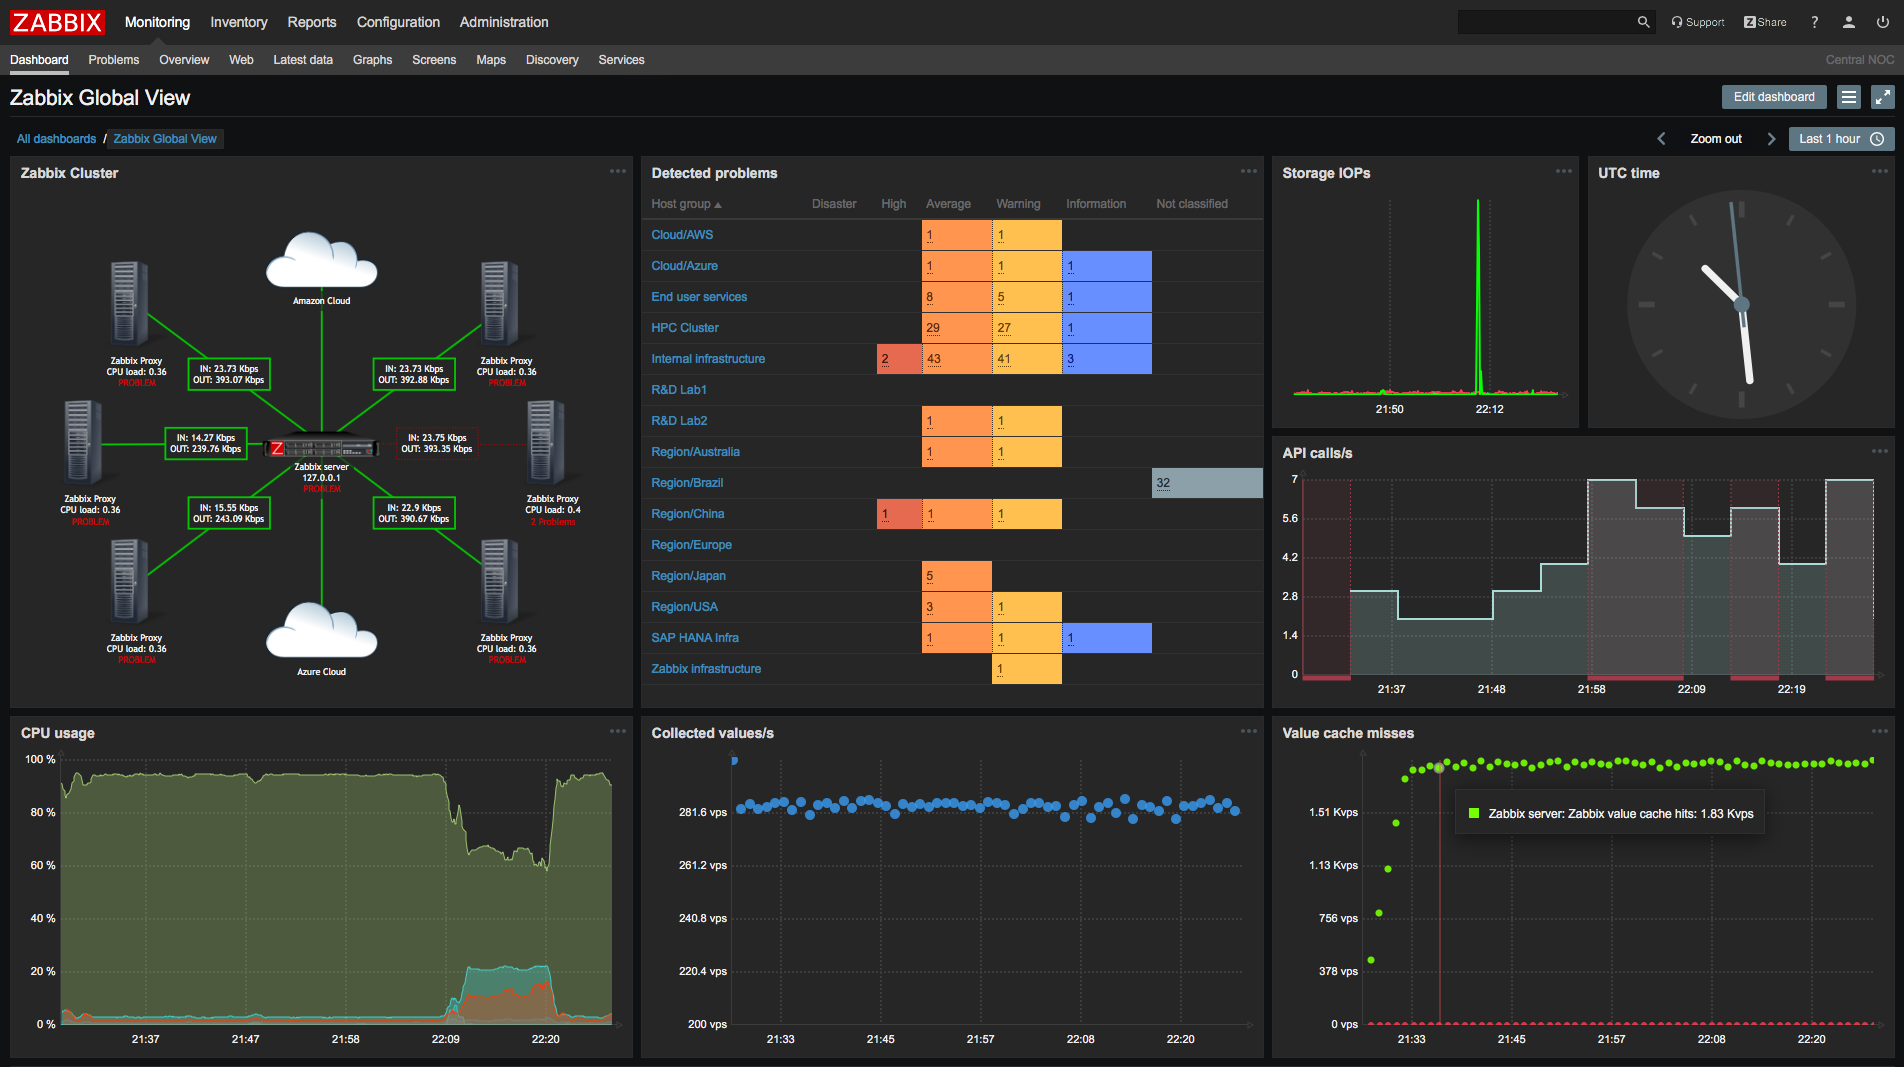
3. Real-Time Graphing
The Zabbix utility enables real-time monitoring of network servers and applications for performance concerns. All of the elements may be graphed immediately since the tool has a function that creates graphs in real-time and displays them in the tool interface. The application also allows you to test the website’s functionality and monitor its response time.
4. Different Visualization Options
The programme has the capability for creating custom graphs, which allows you to simply combine many things into a single view. The reports are created by the Zabbix programme to allow for issue analysis. A monitoring tool can effortlessly monitor all of the resources.
5. Information Retention
The information is saved in a database that is linked to the tool. The tool also keeps a customizable history. The Zabbix utility supports several types of databases, making it easier to handle data.
6. Templates and simple configuration.
Individuals and organisations use the Zabbix tool for monitoring because it allows them to add monitored devices, known as hosts. Once the host is installed, monitoring activities on the host can be done, and templates for the monitored devices may be applied. The application also has a function for group testing using templates. One template can inherit the attributes of another template, giving the user more options. A Zabbix proxy is used for remote monitoring and is appropriate for complicated setups.
7. Simple Web Interface
The Zabbix utility has a web interface written in the PHP programming language. The web interface is accessible from any place. The logs created by the web interface are easily auditable. The tool also contains a permission system that allows the user to be authenticated, and only genuine users are permitted to use it. Specific users’ access to features may be restricted based on their bundle.
Importance
It is used to keep an eye on application and network servers and has a number of other uses, which are listed below:
- The Zabbix monitoring tool is an open-source monitoring tool that both individuals and organisations may use, and the software’s source code is freely accessible. When a business seeks to decrease operating costs, the open-source Zabbix monitoring tool might be deployed. The Zabbix monitoring tool has a very rapid configuration and setup procedure.
- It is a powerful tool for monitoring networks and servers, as well as database management. The Zabbix agent offers network monitoring capability. The Zabbix Agent makes it simple to increase capacity.
- Notification & Notification Module: The Zabbix tool delivers notifications and alarms for any anomalous network activity. This feature allows users to send notifications in order to deliver crucial information and conduct relevant actions. Users can get notifications in a variety of ways, including SMS, email, Jabber, and others.
- It is important because the tool’s GUI is simple to use and may be used by the user to monitor the network and servers for performance bottlenecks. The interface allows you to quickly customise the tool and may be used to display the visualisation. The Zabbix programme provides a single GUI for seeing the whole IT environment.
Conclusion
It is an open-source monitoring tool for network servers and applications that assists users in identifying performance bottlenecks in the network. The programme has numerous capabilities that aid in the monitoring and debugging of threats and issues.
FAQs
What is the purpose of Zabbix?
It is a free and open source monitoring software solution for many IT components such as networks, servers, virtual machines (VMs), and cloud services. Monitoring indicators provided by Zabbix include network utilisation, CPU load, and disc space use.
Is Zabbix completely free?
It is distributed under the GPL licence, making it free for both commercial and non-commercial use. There are no restrictions on the number of devices that may be watched; you can use Zabbix to monitor thousands of devices for free.
Which is superior, Nagios or Zabbix?
Excellent dashboard. The Nagios Core dashboard offers basic information such as device status, but it lacks the clarity and presentation quality of Zabbix. Excellent dashboard. It has the upper hand in terms of production value.
Is Zabbix a SIEM solution?
Splunk is well-known for its log management and security information and event management (SIEM) products. Zabbix is free software that lets you keep an eye on the IT infrastructure of your business. This includes networks, servers, virtual machines, and cloud services.